-
Introduction
The U.S. Department of Energy (DOE) Office of Legacy Management created this application to allow the public to view
environmental data of sites managed by the DOE and build reports on this data. The Geospatial Environmental
Mapping System (GEMS) application provides tools to search for a site, view inspection photos, well logs, and
environmental data. This application allows users to view LM Sites on a 2-D map or a 3-D globe. However,
some of the features are not available in 3-D mode.
-
Selecting a Site
There are two ways to select a site. You can choose 'Find a Site' on the sidebar and search for a site using the
site filters, or you may use the attributes table to zoom to a site. The attributes table is updated when you
select an option. This allows you to view data from related sites. For example, if you select a Regulatory Driver,
you can then use the attributes to zoom to each site to view environmental data and reports.

Changes to any of the sidebar filters will change what is displayed in the Attributes Table (5) above.
-
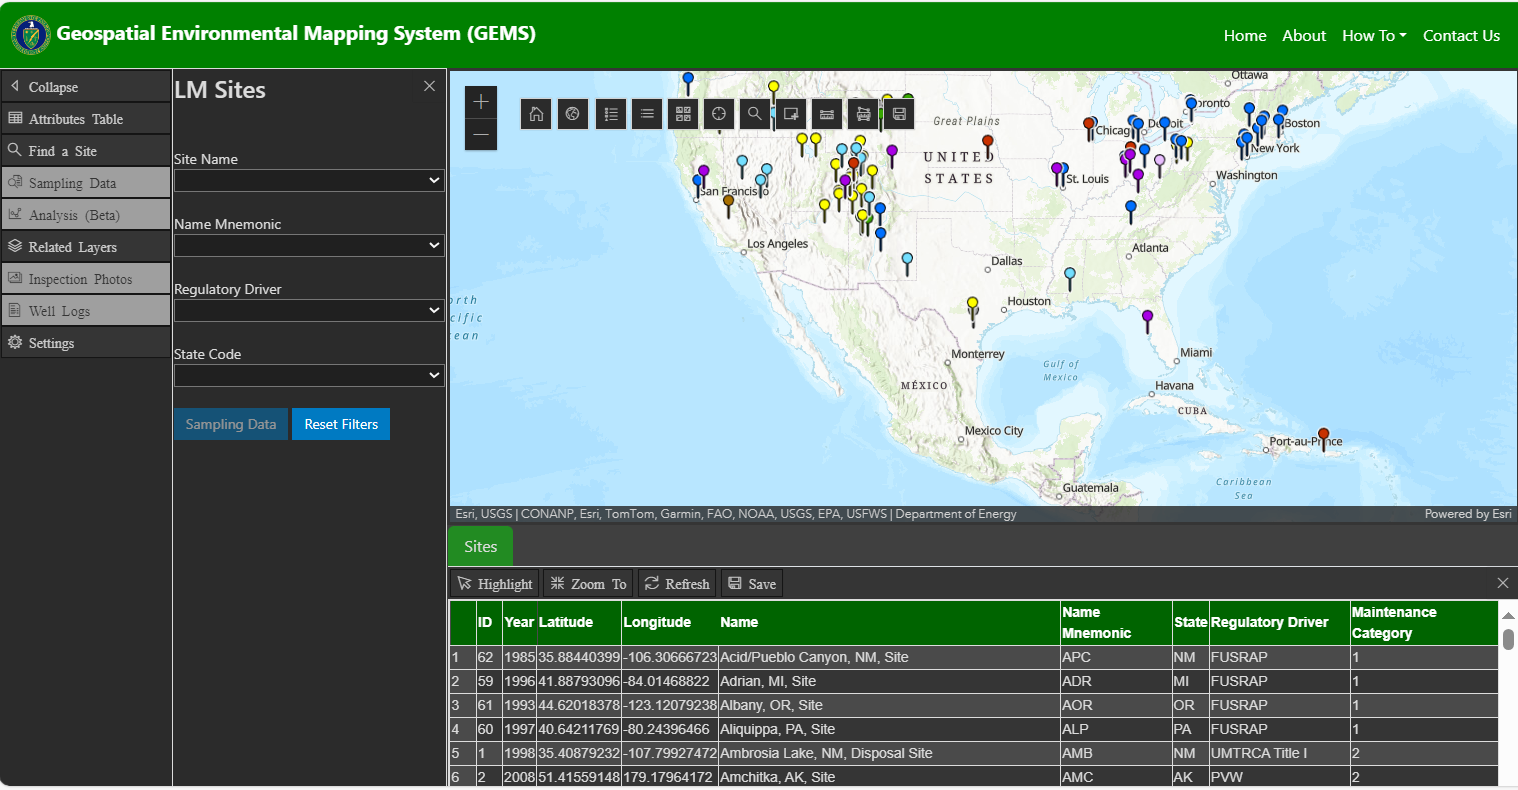
Selecting a Site Using Filters
Several filters are provided to narrow the search for specific sites. Filters update the
attributes table and map. Turning layers on and off in the map also updates the filters.
-
Site Name
In the figure above the Site Name filter (1) is used to select a site using its name. Ex: ‘Tuba City, AZ, Disposal Site’.
-
Name Mnemonic
Use the Name Mnemonic filter (2) to select the three-letter abbreviation for the site. Ex: Select ‘TUB’ for ‘Tuba City, AZ, Disposal Site’.
-
Regulatory Driver
The Regulatory Driver filter (3) will filter the map to only show sites according to the selected Regulatory Driver, for example: ‘FUSRAP’. The LM Sites on the map are organized by Regulatory driver. Each driver is rendered using a different color in the map. You may also use the map Layer List to turn Regulatory Driver layers on or off.
-
State Code
The State Code filter (4) is used to select a U.S. State to view all data for that state. This updates the attributes table and limits the filers to the specific state. You can select a site via the attributes table to quickly move around a state.
-
Selecting a Site Using the Attributes Table
The attributes table shows additional information on each site shown in the map. Using the filters, you may select a state or regulatory driver and view environmental data for each site by zooming to each site using the ‘Zoom To’ button. You may also save the results as a CSV file. The ‘Highlight’ button (6) (defaults to ‘off’) highlights a site on the map when you select the corresponding site in the attributes table. The button is highlighted when this feature is turned on. Click the ‘Highlight’ button to turn highlighting off.
-
Highlighting a Site on the Map
You may use the attributes table to highlight selected sites on the map by clicking the ‘Highlight’ button (6). This turns on the highlight feature so when you select a row in the attributes table, that site is highlighted on the map. Click this button again to turn highlighting off.
-
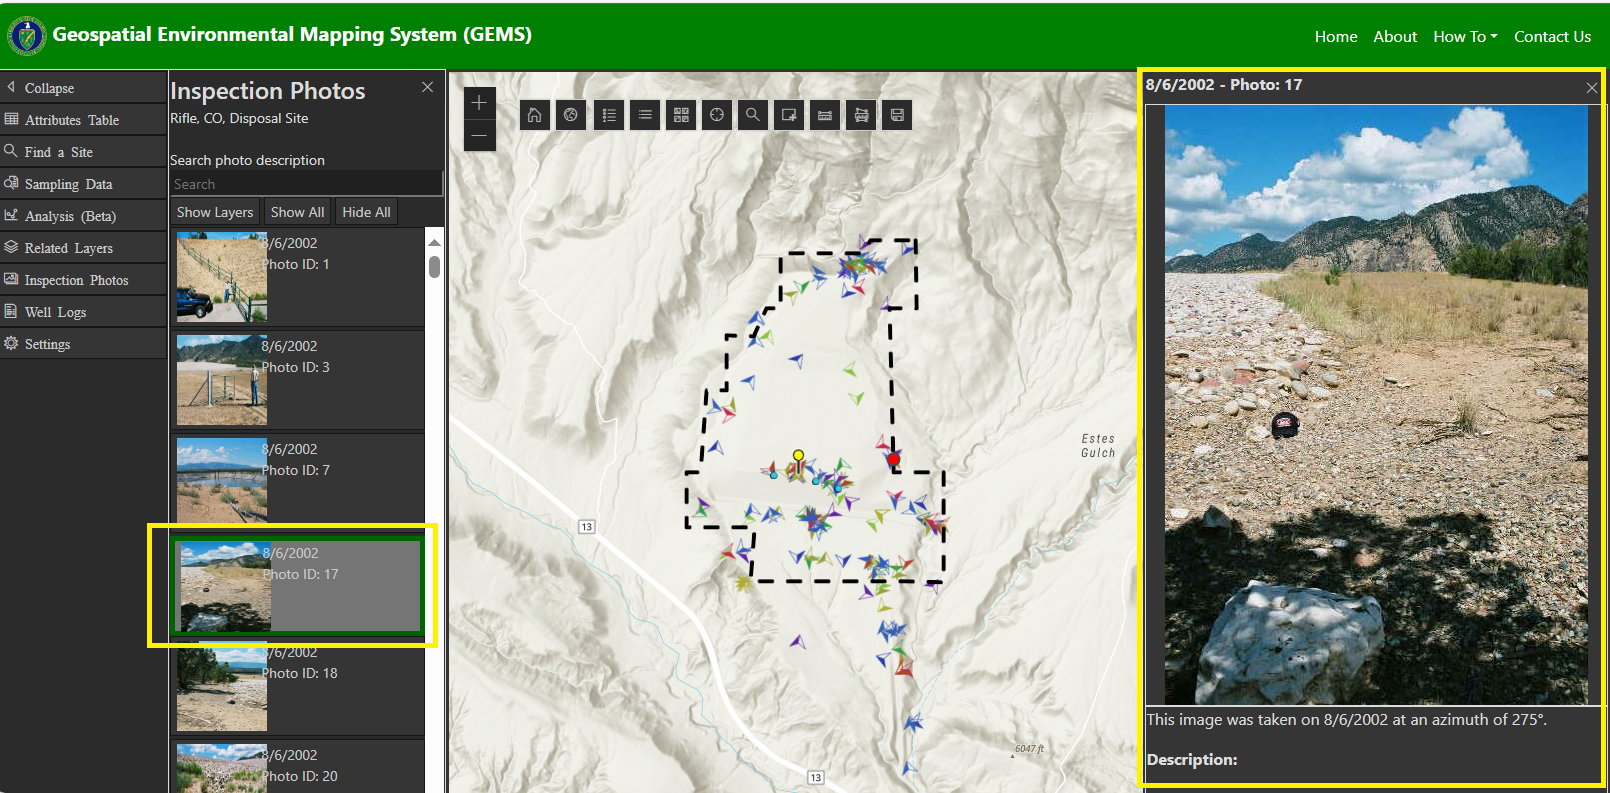
Inspection Photos
After selecting a site, the ‘Inspection Photos’ button on the sidebar becomes available. Selecting this will display all inspection photos for the selected site (1). You may also search photos for text in the image description such as “sign”.
To view the photo locations, click on the Layer List button (2) to display the layer list, and turn on the inspection photos layer (3). These listed by year. Turning these layers on or off will update the photos being shown (4). You can view photos for only one year by clicking “Hide All” to remove all the locations on the map and photo list. This sest the visibility of the photo layers to “hidden”. Then you can turn the layer for the year that you want to see photos for back on.
Clicking on an image snapshot will display a preview of the image along with a description of the image as shown below, and the image location will be highlighted in the map. Click on the image in the image panel to view the full-sized image.
-
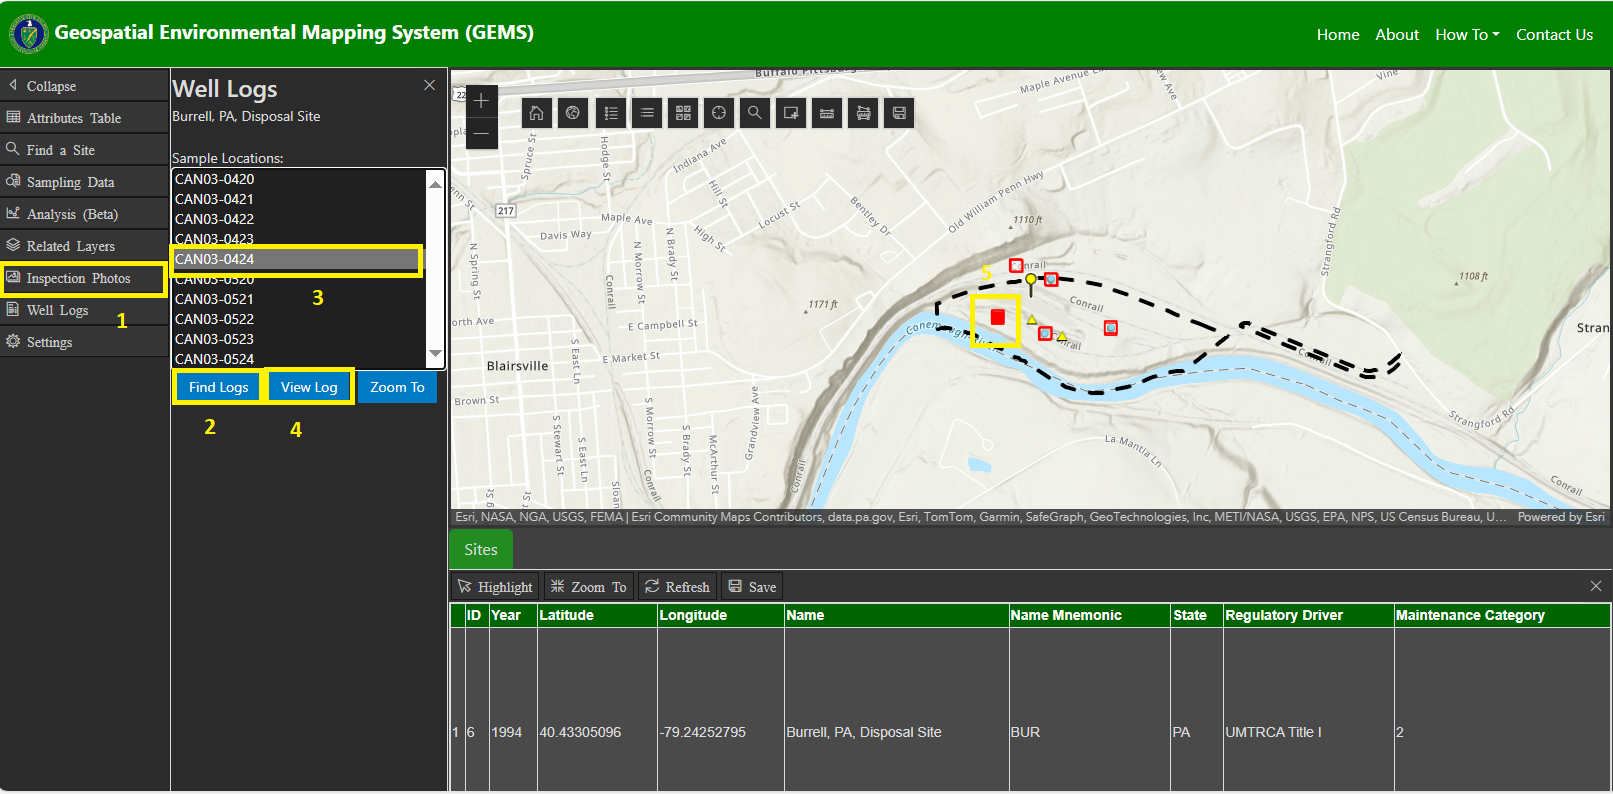
Well Logs
After selecting a site select “Well Logs” (1) on the sidebar then click the “Find Logs” button (2) to show the wells with log data. Clicking on a sample location in the list (3) will highlight the selected location on the map (5). Click on the “view Log” button (4) to view a PDF of the well log.
-
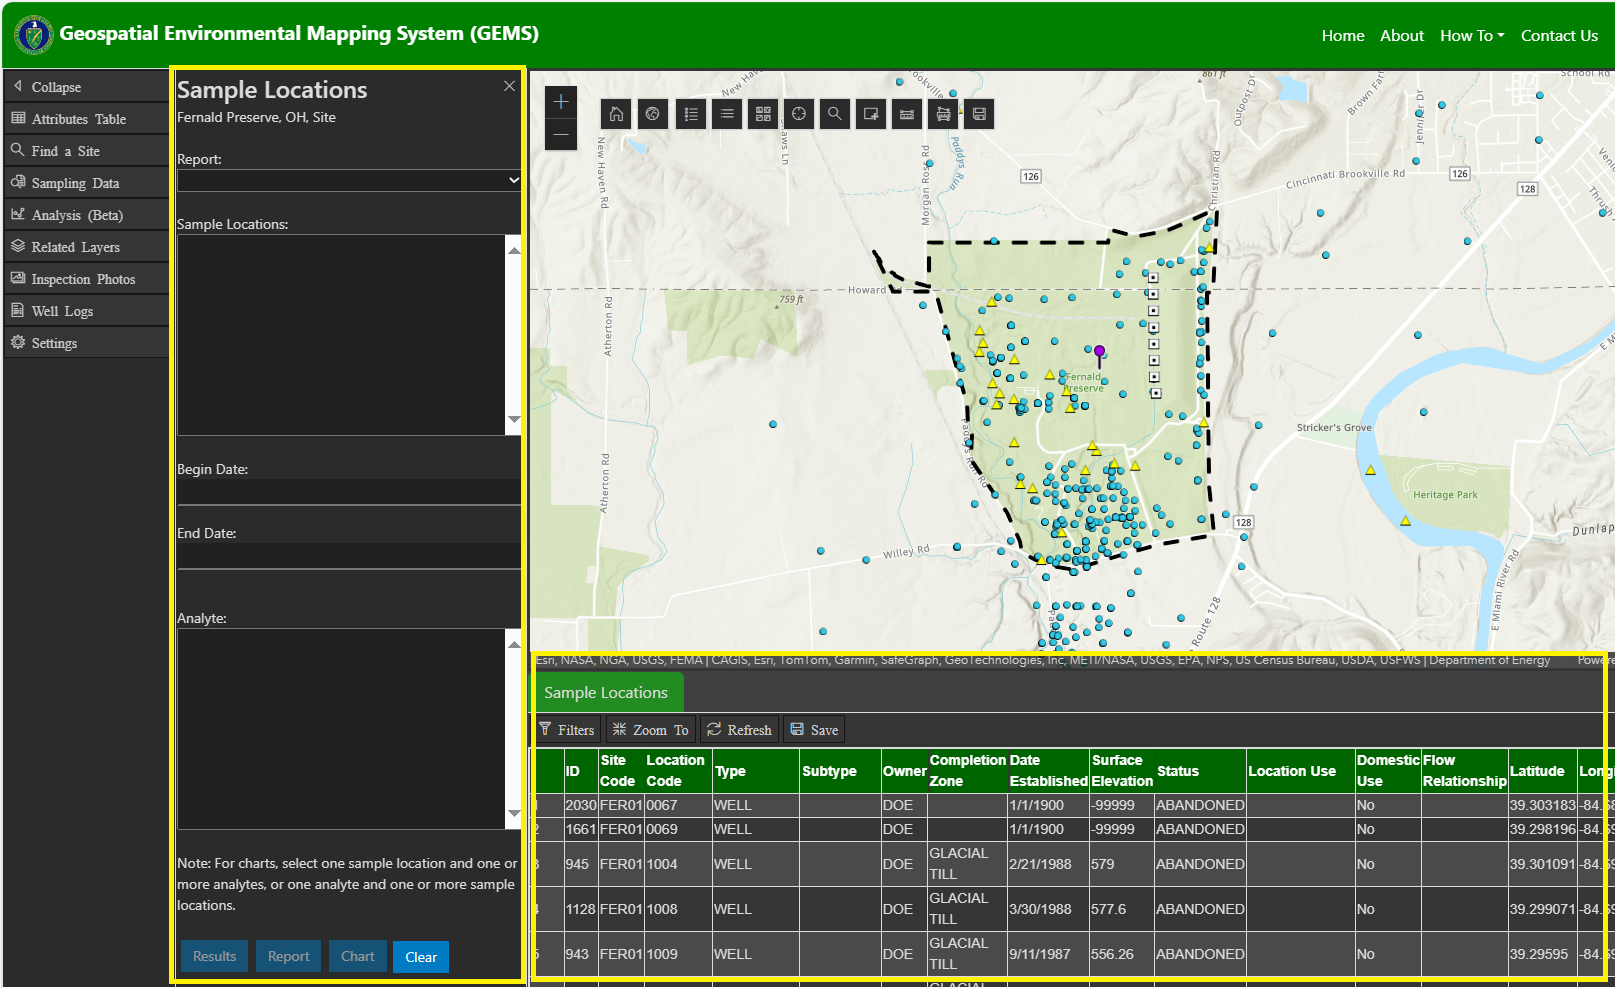
Viewing Environmental Data
Once you have selected a site you can view the environment data by either clicking on “Sampling Data” button on the LM Sites Filters panel (1) or by clicking on the “Sampling Data” button on the sidebar (2). You can view the data in as a data report, chart, or results table that can be downloaded as a CSV file. When you’re done viewing environment data for the site and want to review another site, just click on “Find a Site” on the sidebar bar to return to LM Sites.
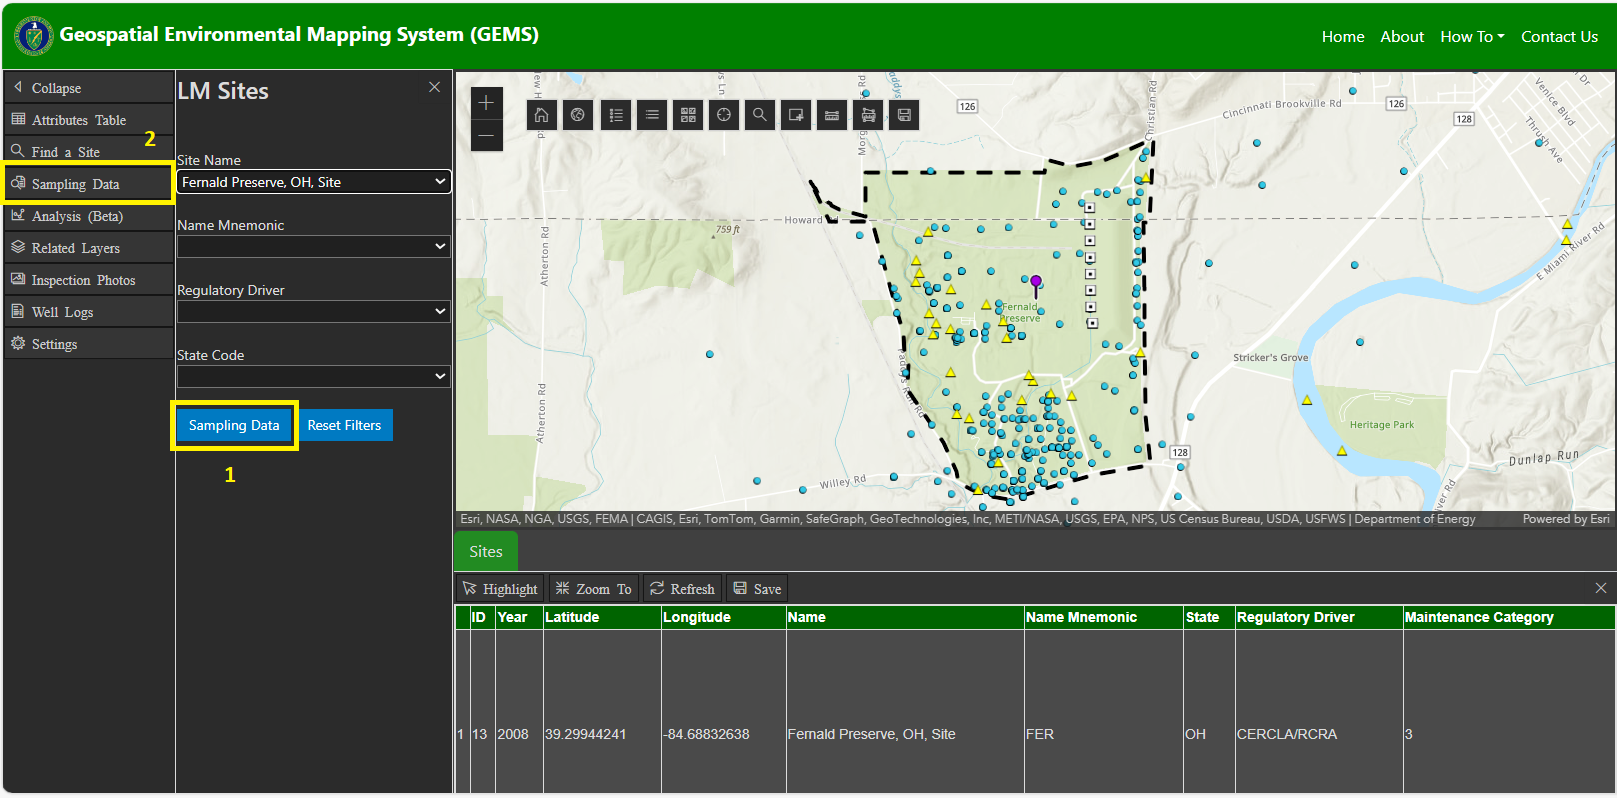
After clicking the “Sampling Data” button the attributes table should also change from showing LM sites to showing the sample locations for the selected site, and the filters panel should change to report filters, below.
-
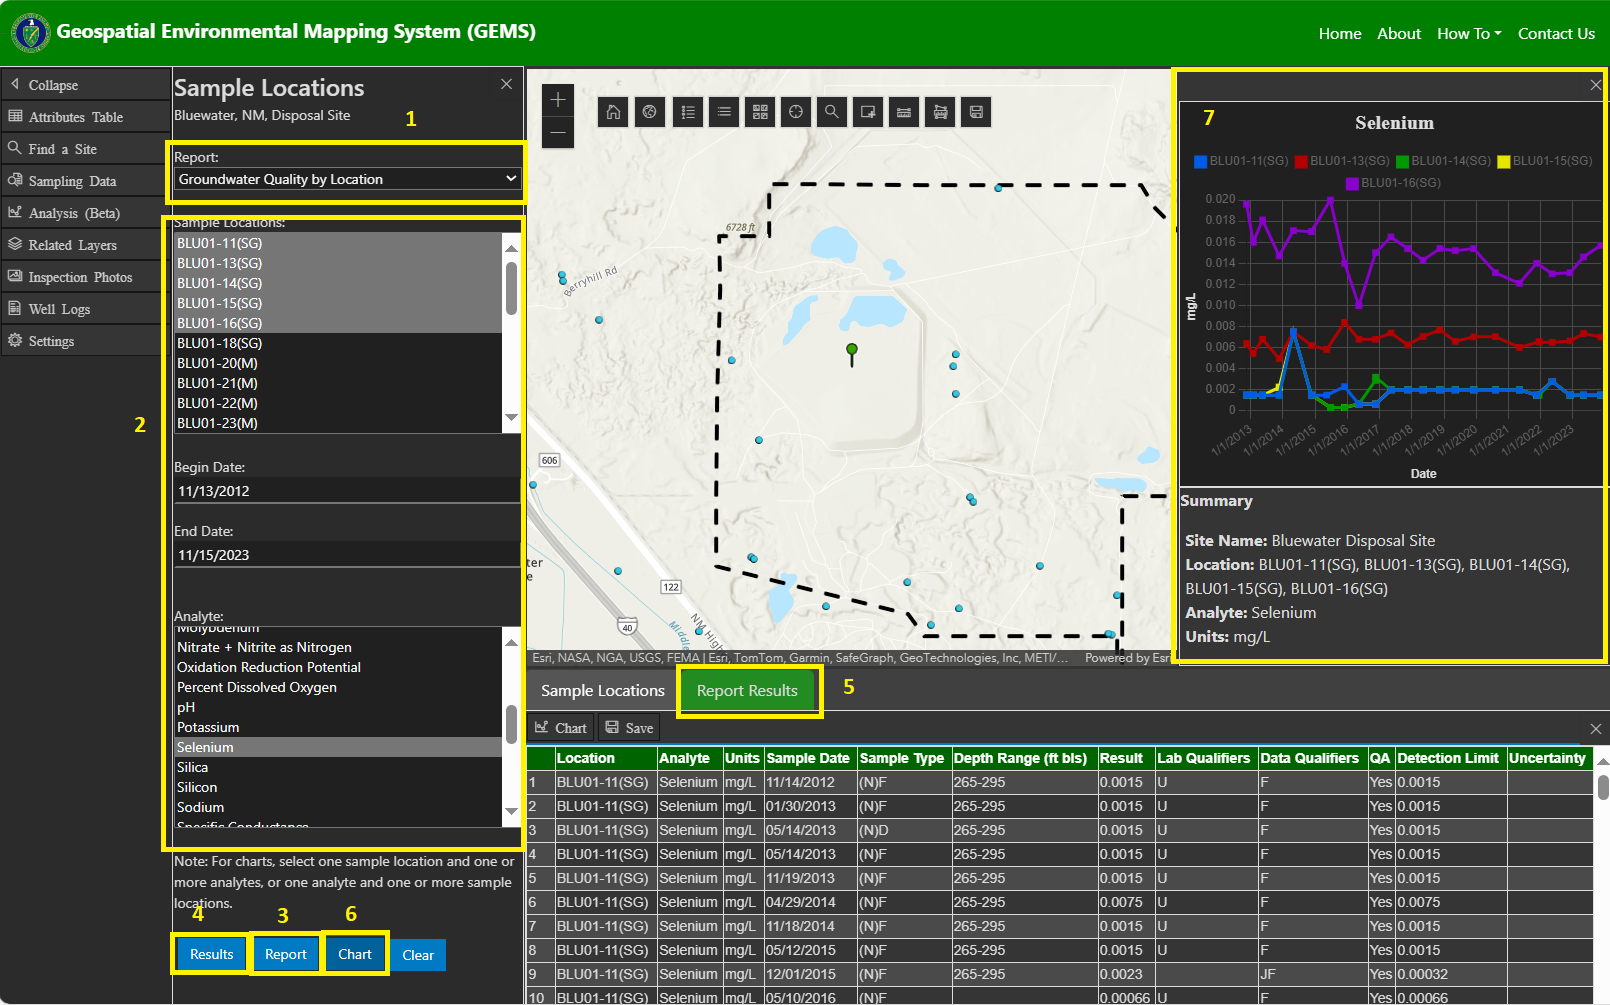
Report Filters
First select a report type (1). Each report type will have different locations with data for the selected report and analytes and dates. Sample locations and dates and analytes will not be populated until a report is selected first.
Each report may have different sample locations, and each sample location may have different analytes and dates, so these are updated depending on the selection. You may select multiple sample locations and multiple analytes.
To view environmental data, select one or more sample locations, dates, and one or more analytes (2). Then click on the “Report” button (3) to generate a data report or “Results” (4) to show the environmental results in an attributes table (5). The “Chart” button (6) will show the data in a chart (7). Non-detects will show up as a hollow point and detects are filled.
-
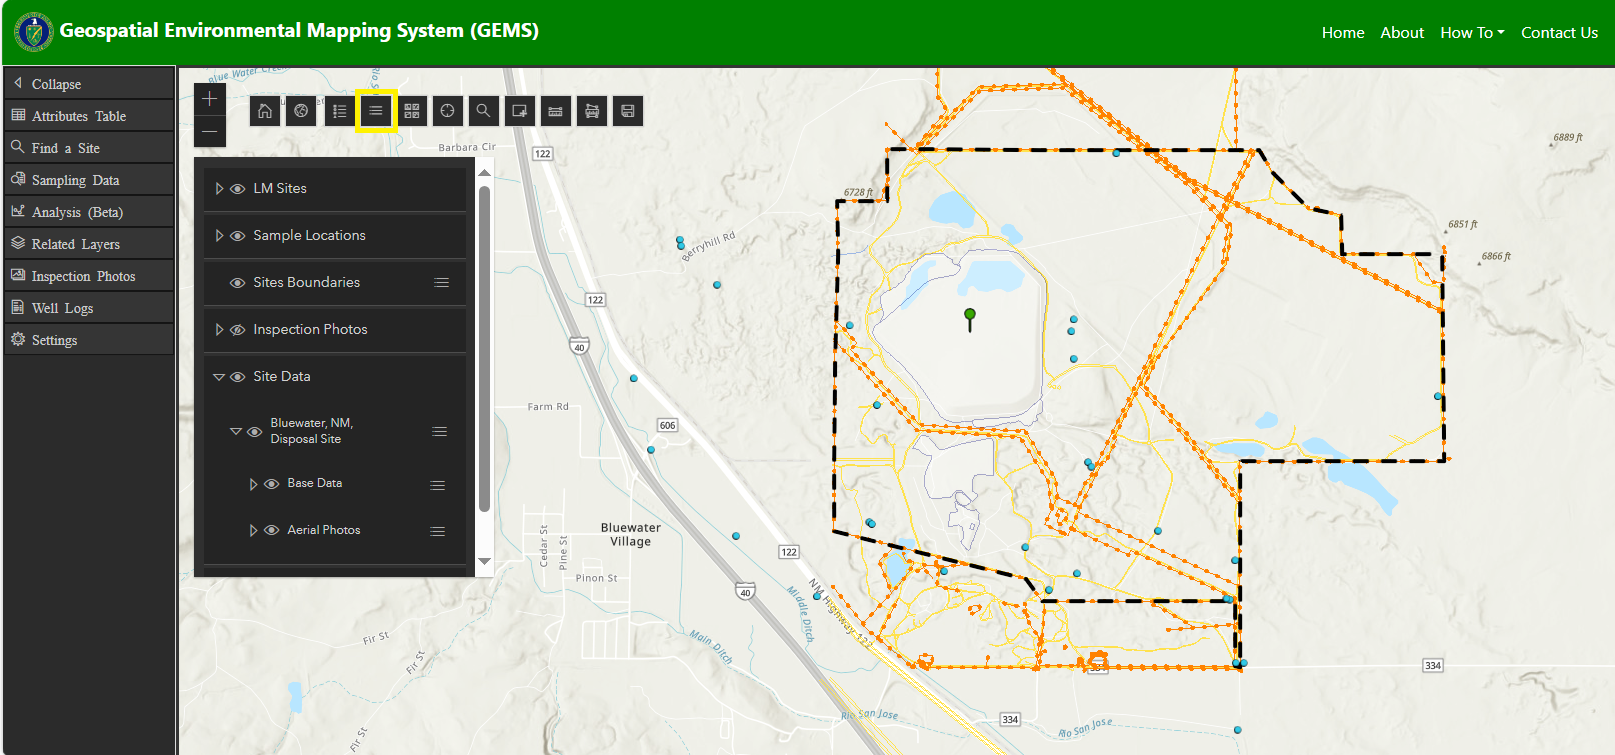
Viewing Site Data
Site data will be added automatically to the Layer List. It will be updated whenever a new site is selected, but by default this layer is turned off. To view site data, click on the Layer List icon on the map to display the layer list and turn on the “Site Data” layer.
-
Aerial Imagery
Aerial Imagery layers are included in the Layer List but turned off by default. To view aerial imagery, click on the Layer List icon on the map to display the layer list. Then turn on the imagery layer for the year of interest.
Note: Not all sites have aerial imagery.
-
Related Layers
Additional layers can be added to the map such as “USGS – National Hydrography Dataset”. Select “Related Layers” on the sidebar and check the layers that you want to add to the map.
-
Settings
The Settings panel includes viewing options that are not tied to a specific site such as changing how sample locations are rendered. Sample locations can be rendered by Type, Subtype or Geological Completion Zone. Under “Other Options”, the “Load site specific data” and “Load aerial imagery” options identifies whether to load site specific data or aerial imagery by default. These are turned on by default, but there may be a slight performance increase if these are turned off.
The “Show all samples option” allows you to see sample locations of nearby sites. When a site is selected the map automatically zooms into the selected site and only shows sample locations for the site selected. However, in some cases where there is a nearby site, you may want to also see the sample locations of that site as well. Checking this option will also show these sample locations.
You can also check the “Show site envelopes” button to show the site envelope to help distinguish which sample locations are associated with which site. The site envelope extends beyond the site boundary to include all the sample locations associated with that site.
-
Map Tools
This section describes the map tools available on the map display. Some are only available in 2-D mode.
- Home – This button takes you back to the original extent of them map when the map was first loaded. If you are zoomed into a site, you can click the “Home” icon to take you back to the original extent.
- Toggle 2-D/3-D Map – These button toggles back and forth between 2-D and 3-D views. The available buttons will be different depending on which view is selected.
- Legend – This button shows a legend of the layers shown in the map.
- Layer List – This button shows a list of layers shown in the map. This tool allows you to turn layers on or off.
- Basemaps – This button allows you to change the basemap.
- Coordinate Tool – This button displays coordinate conversion tool that provides a way to display user cursor position either as map coordinates or as any of several popular coordinate notations. Additionally, this tool provides a way to convert user input coordinates into a point feature on the map.
- Search for Location – This button provides a search tool that uses the ArcGIS World Geocoding Service to search for locations on the map such as cities, etc.
- Sketch (2-D Only) – This button provides a simple UI for creating and updating graphics on the map. The ability to change the color of items added to the map is not currently supported in this version but will be added in future versions.
- Measure Distance – This button provides a tool for measuring distances. It will draw a line from your first click on the map to the next and continue until you do a double-click to stop. It also allows you to change the units of measure.
- Measure Area – This button provides a tool that allows you to draw a polygon and measure the area and perimeter of the polygon. It will draw a line from your first click on the map to the next and continue until you do a double-click to stop. It also allows you to change the units of measure.
- Save (2-D Only) – This button allows you to save an image of the map as a PDF or PNG file.